A Small Open Source Success Story
Adding 3 missing characters made code run 20x faster.
Map chart slowdown
June 9, 2022 — "Your maps are slow".
In the fall of 2020 users started reporting that our map charts were now slow. A lot of people used our maps, so this was a problem we wanted to fix.

Suddenly these charts were taking a long time to render.
k-means was the culprit
To color our maps an engineer on our team utilized a very effective technique called k-means clustering, which would identify optimal clusters and assign a color to each. But recently our charts were using record amounts of data and k-means was getting slow.
Using Chrome DevTools I was able to quickly determine the k-means function was causing the slowdown.
Benchmarking ckmeans
We didn't write the k-means function ourselves, instead we used the function ckmeans from the widely-used package Simple Statistics.
My first naive thought was that I could just quickly write a better k-means function. It didn't take long to realize that was a non-trivial problem and should be a last resort.
My next move was to look closer at the open source implementation we were using. I learned the function was a Javascript port of an algorithm first introduced in a 2011 paper and the comments in the code claimed it ran in O(nlog(n)) time. That didn't seem to match what we were seeing, so I decided to write a simple benchmark script.
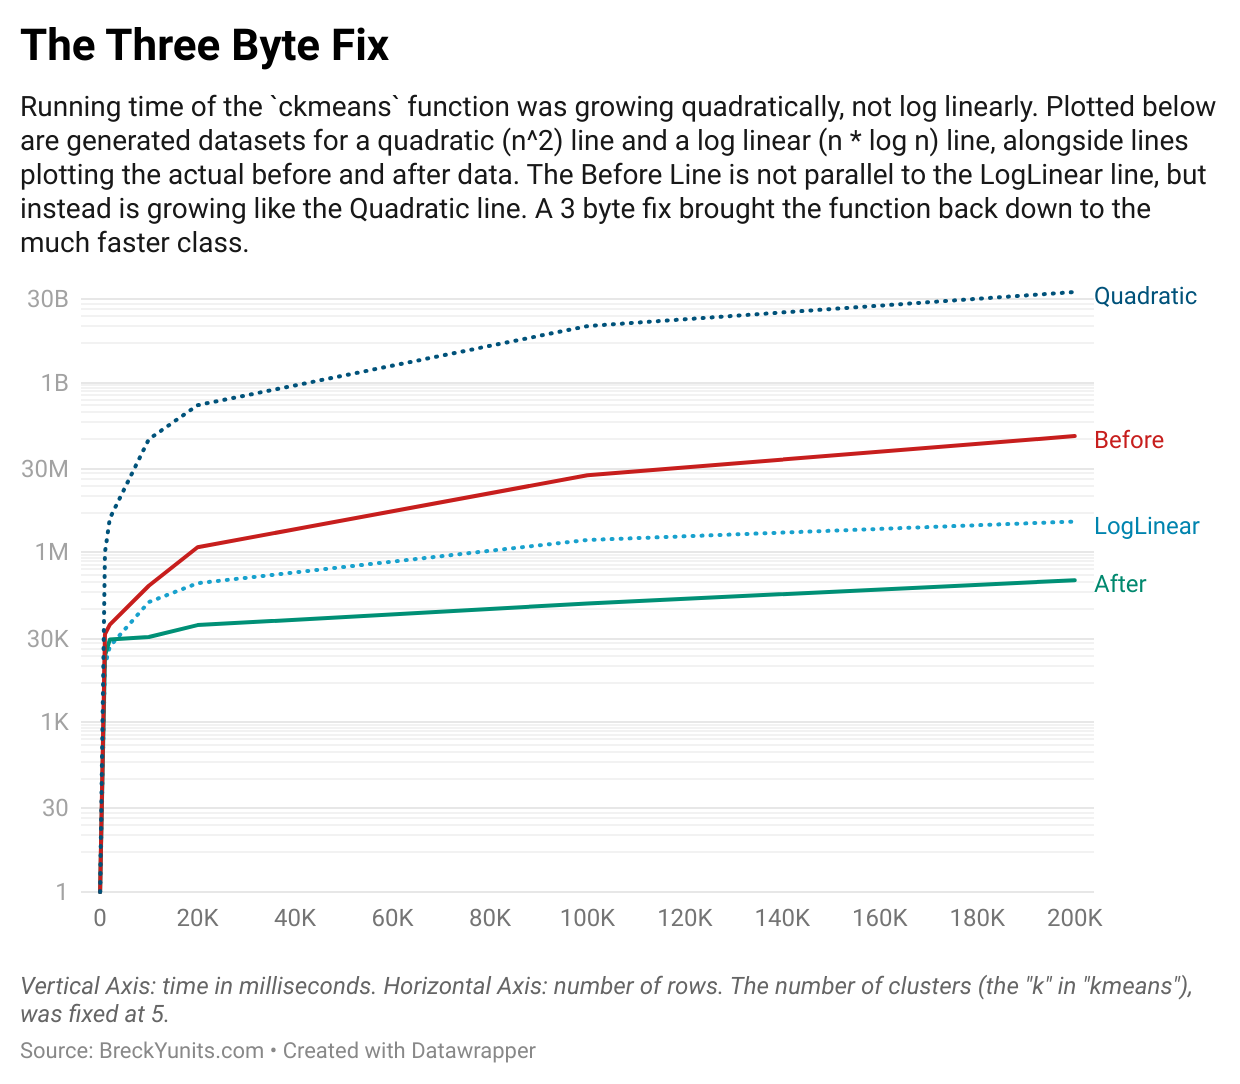
Benchmarking shows closer to n² than n·log(n)
Indeed, my benchmark results indicated ckmeans was closer to the much slower O(n²) class than the claimed O(n·log(n)) class.
Opening an issue
After triple checking my logic, I created an issue on the Simple Statistics repo with my benchmark script.
A fix!
Mere hours later, I had one of the most delightful surprises in my coding career. A teammate had, unbeknownst to me, looked into the issue and found a fix. Not just any fix, but a 3 character fix that sped up our particular case by 20x!
Before:
if (iMax < matrix.length - 1) {

After:
if (iMax < matrix[0].length - 1) {
He had read through the original ckmeans C++ implementation and found a conditional where the C++ version had a [0] but the Javascript port did not. At runtime, matrix.length would generally be small, whereas matrix[0].length would be large. That if statement should have resolved to true most of the time, but was not in the Javascript version, since the Javascript code was missing the [0]. This led the Javascript version to run a loop a lot more times that were effectively no-ops.
I was amazed by how fast he found that bug in code he had never seen before. I'm not sure if he read carefully through the original paper or came up with the clever debug strategy of "since this is a port, let's compare to the original, looking for typos, with a particular focus on the loops".
The Results
The typo fix made the Javascript version run in the claimed n·log(n) to match the C++ version. For our new map charts with tens of thousands of values this made a big difference.
Before xxxxxxxxxxxxxxxx 820ms
After  x 52ms

You can easily see the difference when you look at time needed per additional row as the number of rows increases:
| Rows | LogLinear | Quadratic | Before | After |
|---|---|---|---|---|
| 100000 | 16.60964 | 100000 | 231.22 | 1.25 |
| 200000 | 17.60964 | 200000 | 569.43 | 1.62 |
Full Dataset
| Rows | LogLinear | Quadratic | Before | After |
|---|---|---|---|---|
| 1000 | 9966 | 1000000 | 36000 | 15000 |
| 2000 | 21932 | 4000000 | 53000 | 29000 |
| 10000 | 132877 | 100000000 | 258000 | 32000 |
| 20000 | 285754 | 400000000 | 1236000 | 52000 |
| 100000 | 1660964 | 10000000000 | 23122000 | 125000 |
| 200000 | 3521928 | 40000000000 | 113886000 | 324000 |
Merged
Very shortly after he submitted the fix, the creator of Simple Statistics reviewed and merged it in. We pulled the latest version and our maps were fast again. As a bonus, anyone else who uses the Simple Statistics ckmeans function now gets the faster version too.
Thanks!
Thanks to Haizhou Wang, Mingzhou Song and Joe Song for the paper and fast k-means algorithm. Thanks to Tom MacWright for creating amazing Simple Statistics package and adding ckmeans. And thanks to my former teammates Daniel for the initial code and Marcel for the fix. Open source is fun.
Related Posts
Notes
- The industry term for this type of map is Choropleth map.
- To be precise the algo was
O(knlog(n))time, where k is the number of groups. But I've simplified for this story as that detail is not important. - Wolfram Alpha fit of the quadratic runtime data