Datasets are automated tests for world models
by Breck Yunits
April 23, 2024 — I wrapped my fingers around the white ceramic mug in the cold air. I felt the warmth on my hands. The caramel colored surface released snakes of steam. I brought the cup to my lips and took a slow sip of the coffee bean flavored water inside.
Happiness is a hot cup of coffee in a ceramic mug on a cold day.
But, like happiness, heat is fleeting.
How can I keep the coffee hot?
I am using a free ceramic mug I got at a work conference.
That's the issue.
I pour my coffee into a ceramic mug I bought at HomeGoods.
Expensive mugs hold heat better.
It gets cold anyway.
My hands can feel the heat rushing from the ceramic. It must be the material.
That's the issue.
I buy an insulated metal mug.
A better material than ceramic is the most important thing for holding heat.
It gets cold anyway.
I combine my theories. I buy an expensive insulated metal mug.
It gets cold anyway.
Wrong again.
Let me try a new approach.
I go back to HomeGoods and buy a thermometer and stopwatch.
I line up the 3 coffee mugs. Pour hot coffee in each.
Every five minutes, I write down the temperature in each mug.
I plot the data in a line chart.
There are some differences, but they are minor.
"What are you doing?" my cousin asks.
I explain the situation.
"Try my mugs, they have covers", he says.
I repeat the experiment and add the new data to my dataset.
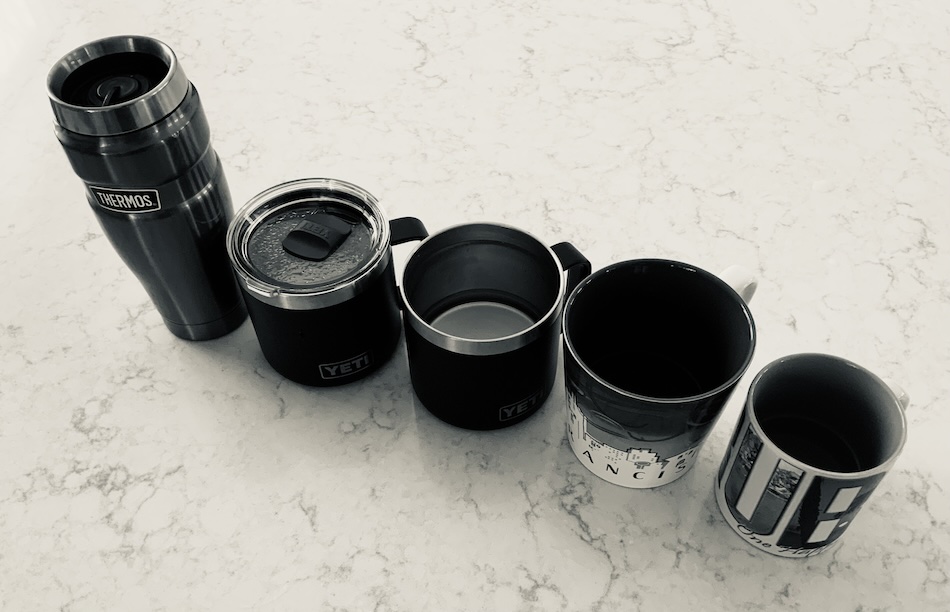
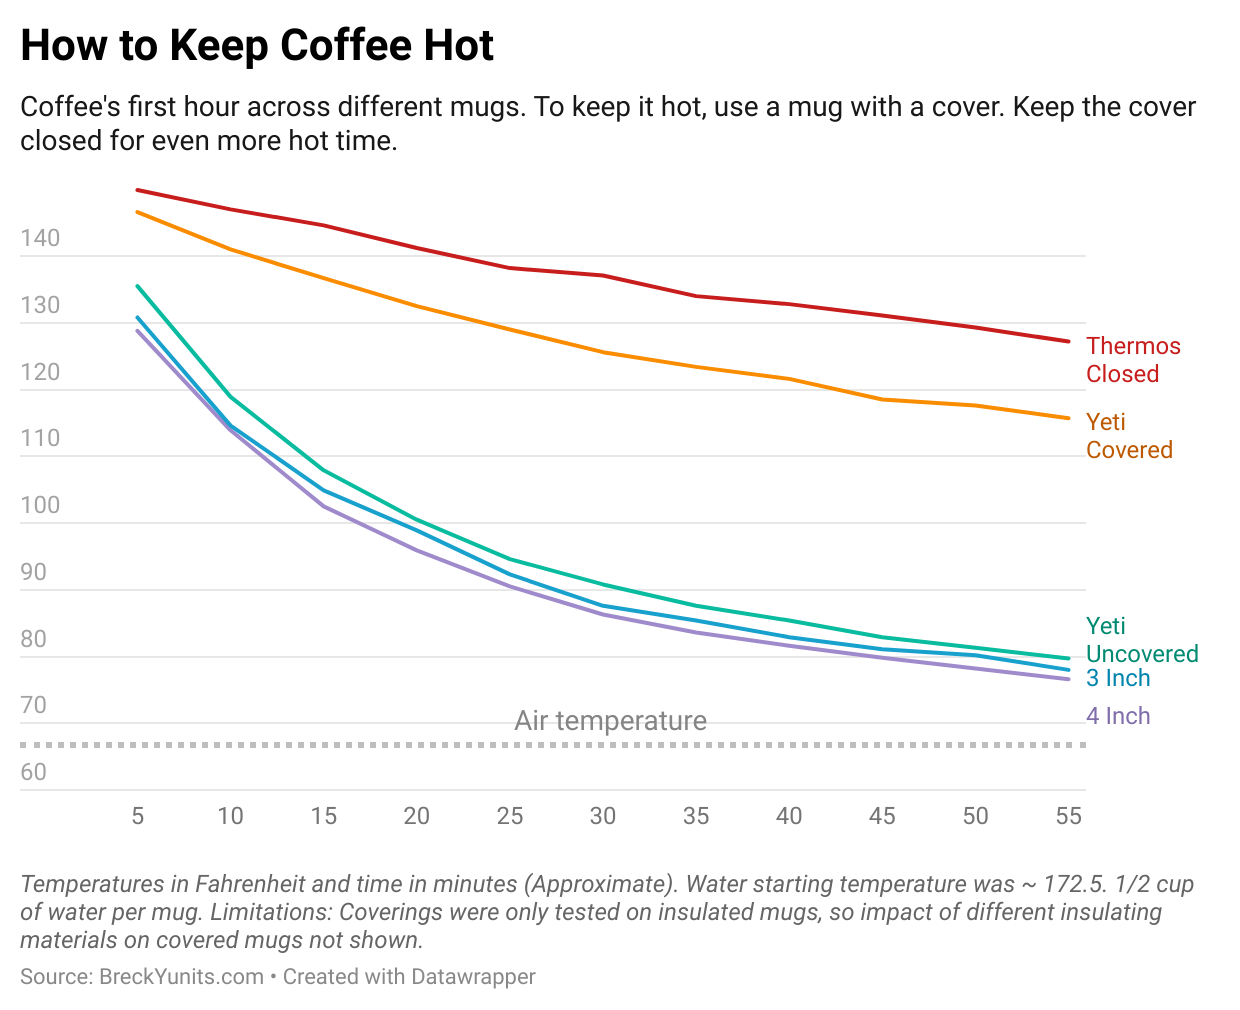
The lab. I measured how long these 5 coffee mugs kept coffee hot.
The coffee in my cousin's covered metal mugs stays hot.
Materials and covers are the key.
I still can't explain why.
What is heat?
I know I can build a much better model.
But I have successfully discarded false models.
And now I have a dataset to test all future models against.
Takeaways
- Datasets are automated tests for world models.
- Building datasets can be done first, orthogonal to models. What Test Driven Development is to programming, Dataset Driven Development is to science.
- You can only hold so many concepts in your head at once, so automated testing from datasets helps more the more complex the system.
- Beware stories lacking datasets!
- Also beware stories that start with true datasets but then discreetly (but swiftly) switch to false ones.
- Love data sharers, beware data misers.
- An ounce of good data is worth a pound of bad models.
- An additional concept, measure, or measurement are all capable of triggering a huge leap toward a more accurate model.
- Datasets are a useful, simple, and timeless tool to discover better models.
- Datasets are particularly good at automating the identification of bad models.
- Tabular UIs have superior ergonomics for humans because they allow more efficient eye movement and require fewer tokens to manage.
- All that being said, remember that datasets are shadows, ultimately the models, not the datasets, are the important thing!
Footnotes
I took some narrative liberties above[1], but for accuracy and fun[2], I really did this experiment.
The Raw Data
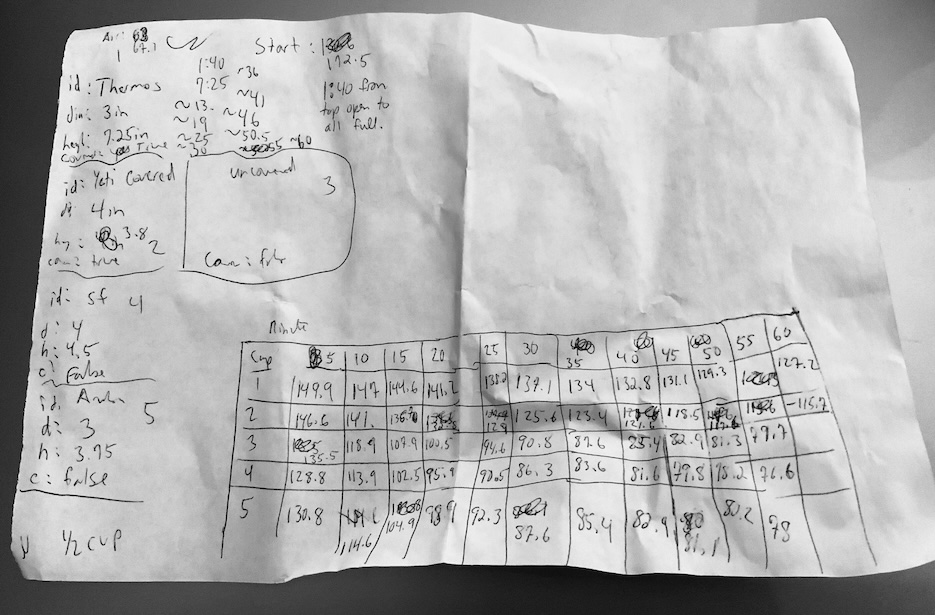
This is both a dataset on thermal dissipation and penmanship deficiency.
The Data Visualized